| What to Expect! |
This is as bad as the most time absorbing
hobbies! You look at the sky and scream at the clouds - give me sunshine
PLEASE. My very modest system was installed in August 2011 and I
admit to inspecting and recording the daily output as displayed on the
inverter display - this is possible as the inverter is located in
our utility room. |
|
| |
|
|
| PVGIS |
The system came with its anticipated annual
generation total estimate so you soon start comparing the estimate with the
actual and initially was unaware of systems that can 'model' my
location - there are a number of modelling but I use PVGIS -hit
this link to visit the site. You can play with this to 'experiment'
on annual, monthly and daily basis. |
|
| |
|
|
| Location |
In this model you give the very basic information
about your location, the total installed capacity (mine is 1.4 kw - not
a lot!), the orientation (azimuth) of your system - that is degrees to
the side of due south - minus for East and positive for West (mine is
+7) and the angle of your system with horizontal being 'zero' - (mine is
15 degrees) |
|
| |
|
|
| Shading |
If you have a skyline that offers shading at any
time of the year (for example trees in winter or a neighbour's chimney)
you can represent this in a simple data file. The results page shows my
shading profile. |
|
| |
|
|
| Results |
Click this link to open the results - two
pages to review PVGISResults.pdf
You will see that the computation has estimated various loss information
all of which has a statistical basis. |
|
| |
|
|
| Weather |
You soon realise that the best generation is
achieved on cool days with an absolutely clear sky for a couple of hours
either side of noon at your location - as I reported a while ago air
traffic vapour trails reduce my generation by 30 % until the sun is
fully open again so the systems are extremely sensitive to the solar
irradiation level. |
|
| |
|
|
| Sheffield |
As you will have spotted Aldous and his team
'treat' individual subscribers data and create a normalised
reference so that we all can compare apples with apples! If you track
the bottom few rows of the Micro-Gen data base spread sheet you will see
the Max, Min, Mean and Standard Deviation for each month - that is a
very useful set of data. Hopefully your system generation will sit
within monthly mean plus/minus the Standard deviation. If you
consistently fall outside this range then it is likely you have a
problem. Mine did and I did have a problem which was resolved on
the evidence of the Micro-Gen data base |
|
| |
|
|
| Monitoring |
I have found the best monitoring period is a
month - within a month daily variations can be massive so you need to
look at longer timescales and the monthly period works well. The Eco-Eye.com
has been fitted (Retro fit) and have found to
be very good as it holds 64 days of data in memory. There is an option
to store the raw data directly to your PC via the USB link at four
second intervals which you can manipulate in spread sheets etc.
|
|
| |
|
|
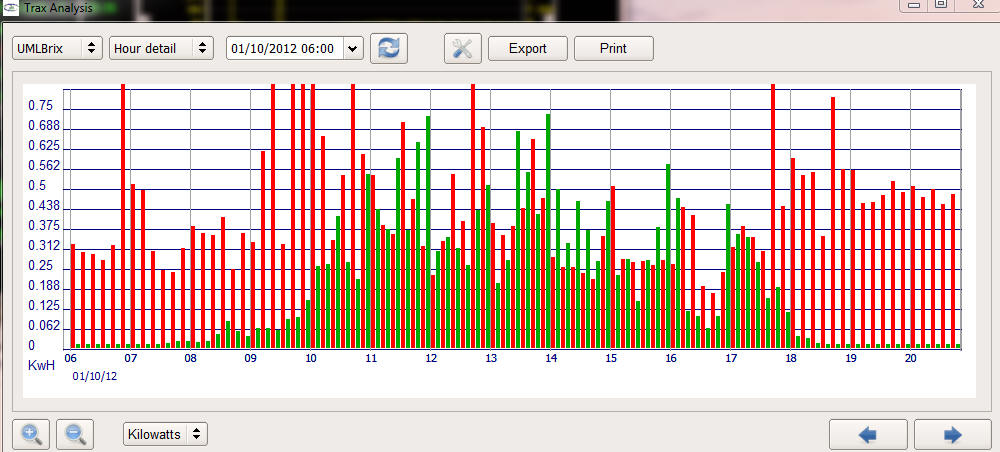
| Hourly Example |
 |
|
| |
|
|
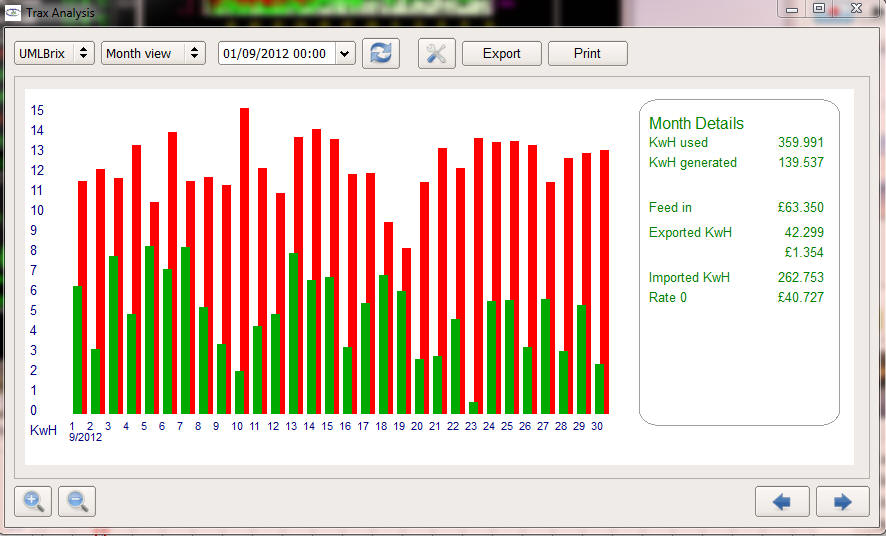
| Month Example |
 |
|
| |
|
|
| Data |
The data to produce these graphs is downloaded
from a special SD card whenever you wish and as you an see, assuming the
correct values are input, you get estimates for the associated tariffs.
|
|
| |
|
|
| Disclaimer |
The above is my take on Solar PV - there is a lot
of professional advice around which will point up the finer detail and
benefits of considering other engineering tweaks but with a system of my
size there will be a 'cost'/'benefit' implications. |
|
| |
|
|
| |
Micr0-Gen Data Base URN139 |
|